Grafana o11y-bench 深入剖析:讓 AI 真正面對 on-call 現場
o11y-bench 深入剖析:讓 AI 真正面對 on-call 現場
從任務設計、合成環境、Agent 架構、評分機制到報告輸出,逐一解析這個開放 benchmark 的每個組件——以及 Gemini 3 Flash Preview 的完整實測結果
先說清楚這在解決什麼問題
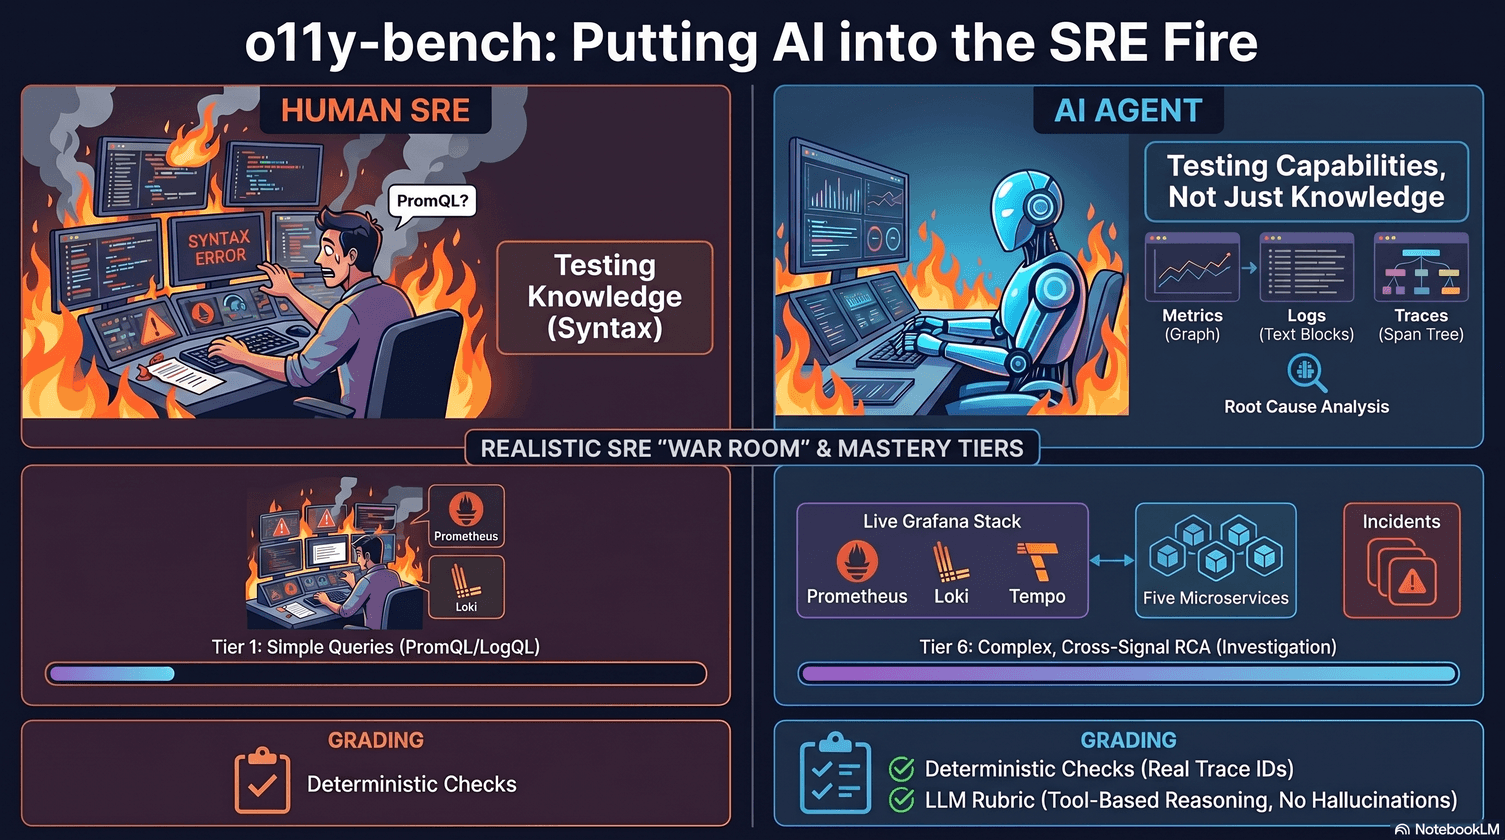
目前多數 LLM benchmark 測的是「知識」:模型知不知道 PromQL 的語法,知不知道什麼是 p99 latency。但 SRE 的工作從來不只是知識問題——真正的挑戰是:能不能在一個陌生的監控環境裡,自主操作工具,把分散在 metrics、logs、traces 三個訊號裡的線索拼起來,找到根因?
metrics 像體溫計(數字趨勢)、logs 像病歷(事件記錄)、traces 像 X ▎ 光(請求在系統內怎麼流動)。on-call 的難處是這三種資料分別存在三個系統裡,要自己拼起來。
Grafana Labs 的工程師 Yasir Ekinci 和 Jack Gordley 在 GrafanaCON 2026 發表 o11y-bench 時,特別強調了 observability 任務的本質差異:
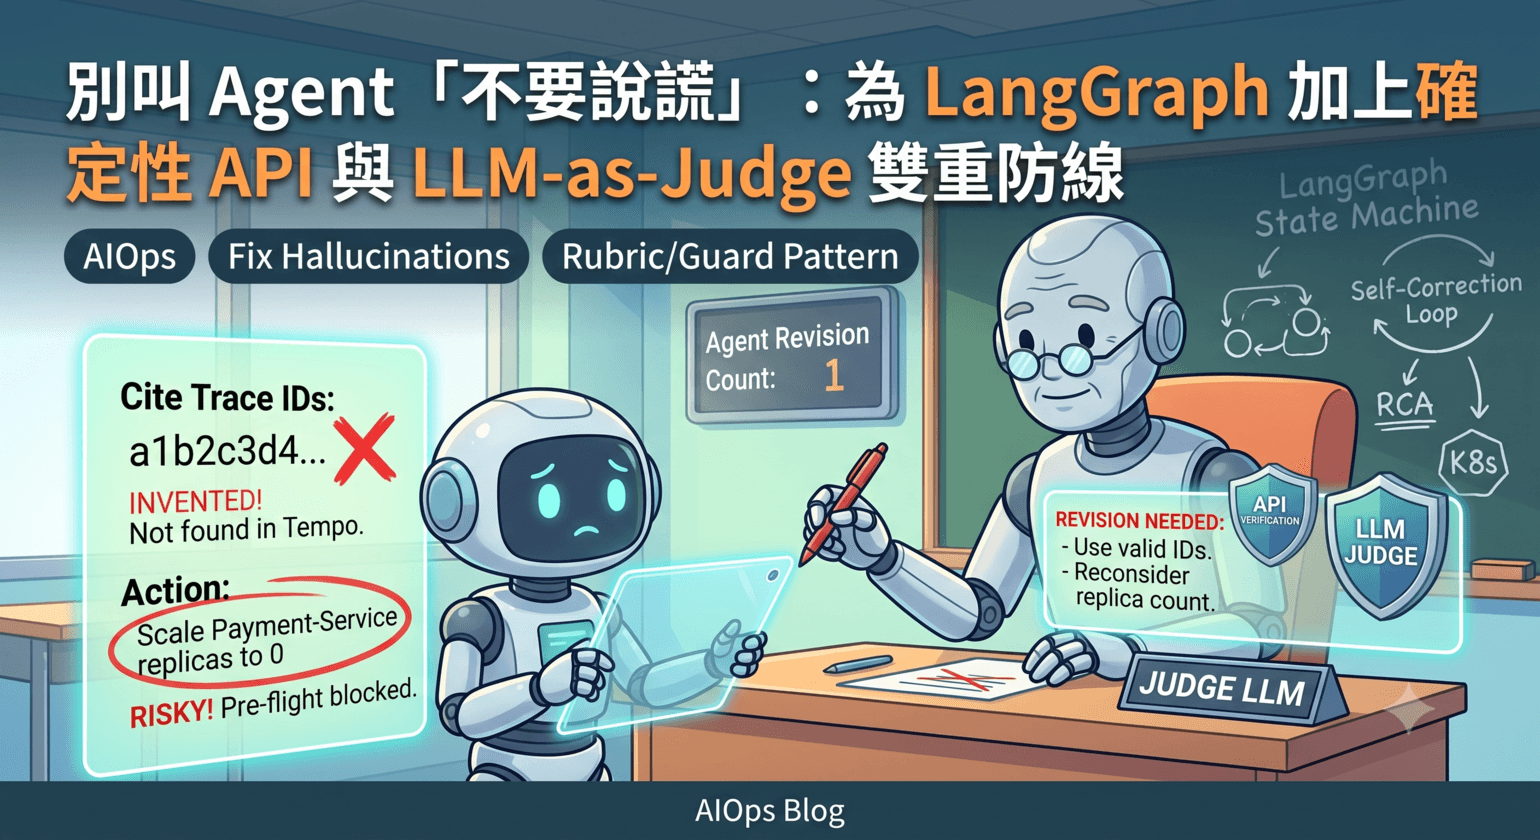
"In observability, the dangerous mistakes are often the subtle ones."
一個查詢語法正確,但選了錯誤的 metric series;一個 dashboard 在 UI 上看起來正常,但 variable binding 沒有真正連上 panels——這類錯誤在一般的 benchmark 裡不會被抓到,但在真實 on-call 場景裡會導致錯誤判斷。這就是為什麼需要一個讓 agent 面對真實 stack、結果由程式直接驗證的 benchmark。
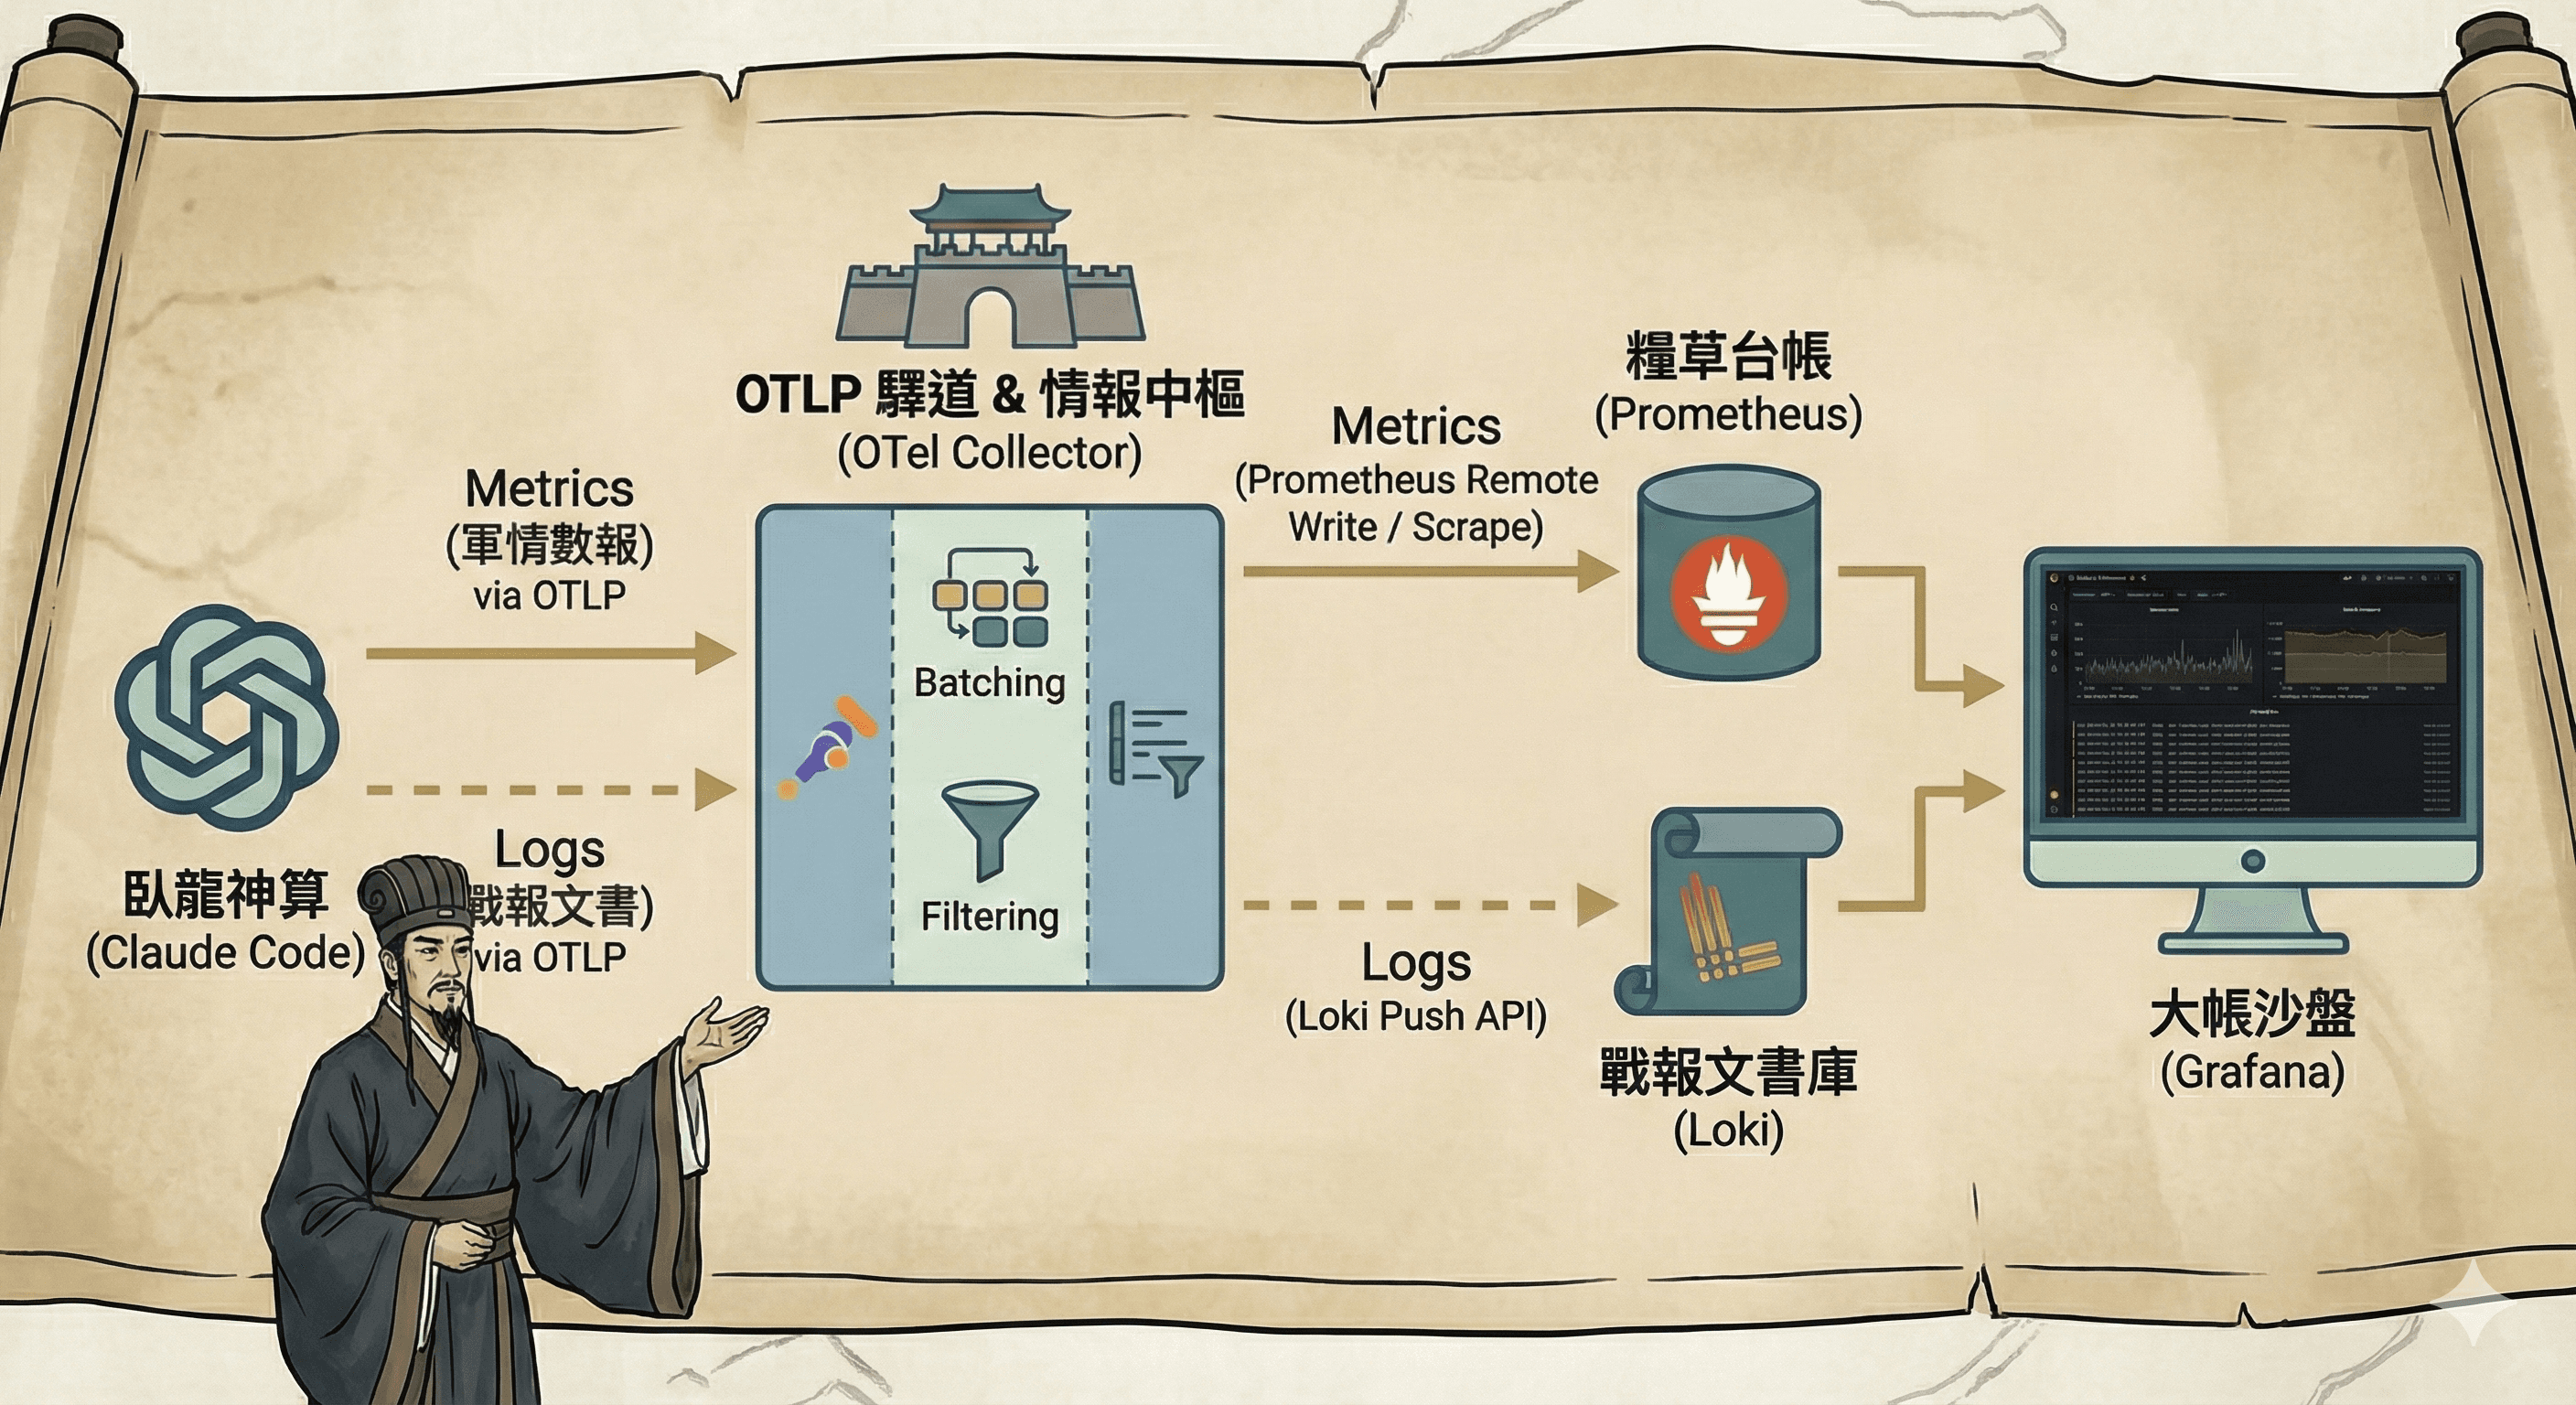
o11y-bench 嘗試回答這個問題。它是由 Grafana Labs 開發的開放 benchmark,基於 Harbor 框架運作,讓 LLM agent 在一個真實跑起來的 Grafana + Prometheus + Loki + Tempo stack 上解題,評分後對外公開 leaderboard。
Harbor → benchmark 執行框架(負責起容器、跑 agent、收結果)
Prometheus → 存 metrics、Loki → 存 logs、Tempo → 存 traces
整體架構鳥瞰

跑一次 benchmark 的流程大致如下:
tasks-spec/  →  (sync)  →  tasks/
                                ↓
                    Harbor 起一個 trial
                                ↓
              ┌─────────────────────────────┐
              │   docker/ sidecar 容器          │
              │   Prometheus + Loki + Tempo    │
              │   + Grafana + mcp-grafana      │
              └─────────────────────────────┘
                                ↓
              ┌─────────────────────────────┐
              │   agents/ agent 容器            │
              │   讀題目 → 呼叫 MCP 工具          │
              │   → 寫出 trajectory.json       │
              └─────────────────────────────┘
                                ↓
              ┌─────────────────────────────┐
              │   grading/ verifier            │
              │   deterministic checks         │
              │   + LLM rubric (Claude)        │
              └─────────────────────────────┘
                                ↓
              jobs/<job-name>/result.json
              jobs/<job-name>/run_report.html
以下逐一拆解每個組件。
組件一:tasks-spec/ — 題目的源頭
tasks-spec/
  prometheus_query/   (16 題)
  loki_query/         (10 題)
  tempo_query/        (13 題)
  grafana_api/        (6 題)
  dashboarding/       (7 題)
  investigation/      (11 題)
tasks-spec/ 是整個專案唯一需要手動維護的 task 資料,tasks/ 是從它生成的 output(不要直接編輯)。執行 mise run setup:sync 會把所有 YAML 轉換成 Harbor 能讀的任務格式。
YAML 格式設計
每個 task 的核心欄位:
id: promql-subquery-peak-error-rate
category: prometheus_query
statement: |
  六小時內,payment-service 的 error rate 峰值是多少?

checks:
  - name: Response cites a trace ID that appears in Tempo tool results
    weight: 70
    type: grounding
    params:
      mode: tool_trace_id

rubric:
  - criterion: The final response states the peak error rate accurately.
    weight: 65
    fact:
      kind: query
      backend: prometheus
      query: max_over_time(rate(http_requests_total{job="payment-service",status=~"5.."}[5m])[6h:1m])
有幾個刻意的設計決策值得注意:
statement 用自然語言,不給語法提示:不寫「用 PromQL subquery」,只說「六小時內的峰值是多少」。這樣才是真正測 agent 能不能選對工具。
數字精確性用
fact:benchmark 自己跑那個 PromQL 拿到 ground truth,讓 judge 比對,而不是把答案寫死在 criterion 文字裡(否則改了資料就要改題目)。具體實體用 grounding check:trace ID 不靠 LLM 判斷,程式直接比對。
grounding check:強制答案裡的具體值(trace ID、service 名)必須真的在工具回傳結果裡出現,防 LLM 編造
一道題包含三個東西:題目(statement)、程式驗的部分(checks)、LLM 評分的部分(rubric)。「rubric」是 LLM 評估常用語:一份評分準則清單。「LLM rubric」就是讓另一個 LLM(這裡是 Claude)當 judge,照清單逐條打勾 YES/NO。後面組件四會展開細節。
六個類別的能力層次
| 類別 | 題數 | 核心挑戰 |
|---|---|---|
| PromQL | 16 | 選對函數(rate/offset/topk/subquery),數字解讀正確 |
| LogQL | 10 | 多階段 pipeline(` |
| TraceQL | 13 | 追 call chain,引用真實 trace ID(有 grounding check 防幻覺) |
| Grafana API | 6 | 直接操作 REST API,不只是用 Grafana UI |
| Dashboarding | 7 | 建出真實可用的 dashboard(state check 直接驗 Grafana 狀態) |
| Investigation | 11 | 跨三個訊號做根因分析,全靠 LLM rubric |
PromQL(16 題)—— 結構化查詢的精確度
最基礎的一層。題目用自然語言描述,不給語法提示,例如:
「找出六小時內 payment-service 的 error rate 峰值」
模型需要自己決定用 subquery、offset、topk 還是 rate,並且對計算出的數字做出正確解讀。
代表題目:
| task | 測什麼 |
|---|---|
promql-error-rate |
三個 service 合計 5xx share |
promql-burn-rate-assessment |
比較 payment-service 現在 vs 6h 前的 error rate(offset) |
promql-subquery-peak-error-rate |
找 6h 內的 error rate 峰值(subquery) |
promql-topk-5xx-share |
哪個 backend 貢獻最多 5xx(topk) |
query-cpu-metrics |
比較各 job 的 CPU 用量並排名 |
promql-capacity-analysis |
記憶體用量趨勢與容量評估 |
LogQL(10 題)—— 半結構化資料的處理能力
Loki 的 LogQL 比 PromQL 難在:必須先做 pipeline 解析(| json | __error__=""),才能對欄位做聚合。測試案例包括找最慢 endpoint(需要 unwrap duration_ms)、計算 p95 latency、區分 retry 造成的假 5xx 和真實錯誤。
代表題目:
| task | 測什麼 |
|---|---|
logql-top-5xx-endpoint |
按 path 統計 5xx,找最多那條 |
logql-multi-stage-pipeline |
找最慢 endpoint(unwrap duration_ms) |
logql-parse-json-logs |
JSON log 解析與欄位過濾 |
logql-unwrap-orders-p95-latency |
計算 /api/orders 的 p95 latency |
logql-retry-vs-real-errors |
區分 retry 造成的 5xx 和真實錯誤 |
logql-deployment-rollout-events |
從 log 找 deployment 事件時間線 |
TraceQL(13 題)—— 跨服務的因果推理
分散式追蹤是三個訊號裡最難操作的。測試重點:
能否準確引用真實的 trace ID(有 grounding check 防止幻覺)
能否沿著 call chain 追蹤 error 傳播路徑
能否用 TraceQL metrics 計算各 service 的 error rate
代表題目:
| task | 測什麼 |
|---|---|
traceql-error-chain-orders |
找 POST /api/orders 的 failing trace,說明 error 傳播路徑 |
traceql-structural-query |
order-service checkout 流程的 downstream call chain |
traceql-tail-latency-bottleneck |
找 p99 最慢的 service 和 span |
traceql-metrics-error-rate-by-service |
用 TraceQL metrics 計算各 service error rate |
Grafana API(6 題)—— REST API 直接操作
不只是用 Grafana UI,而是要能直接操作 REST API 讀取 datasource 設定、搜尋 dashboard、檢查 panel 查詢內容。
| task | 測什麼 |
|---|---|
list-datasources |
列出所有 datasource 的名稱和 type |
get-datasource-details |
取得特定 datasource 的 URL 和 access mode |
search-dashboards |
搜尋 dashboard list |
inspect-dashboard-queries |
讀取 dashboard panels 裡的查詢內容 |
audit-service-overview-variable |
確認 dashboard variable 的設定 |
Dashboarding(7 題)—— 能不能建出真實可用的東西
這類題目以 deterministic check 為主:agent 建完 dashboard 後,benchmark 直接打 Grafana API 驗證 panels 是否存在、datasource 是否正確、variable binding 是否真的生效。
| task | 測什麼 |
|---|---|
dashboard-create-service-overview |
建立含 timeseries、stat、logs panel、variable、annotation 的完整 dashboard |
dashboard-add-cache-lag-panels |
在現有 dashboard 加入 cache lag 相關 panels |
dashboard-add-deployment-annotation |
加入 deployment 事件 annotation |
dashboard-update-add-service-variable |
加入 service dropdown variable 並讓所有 panel 跟隨 |
dashboard-repair-cache-review |
修復有問題的 dashboard |
dashboard-create-service-overview 是最複雜的 task,要求一次建立 5 種 panel type + 1 個 multi-value variable + 1 個 Loki annotation,並驗證 variable binding 在選不同 service 時真的生效。
Investigation(11 題)—— 跨訊號的根因分析
最困難的一層,也是最接近真實 on-call 工作的場景。沒有 deterministic check,全靠 LLM rubric。典型題目:
「api-gateway 出現 5xx,請判斷是自己的問題還是 downstream 傳上來的?」
| task | 測什麼 |
|---|---|
incident-triage |
跨 Prometheus + Loki 找出哪些 service 受影響、何時開始 |
payments-path-root-cause |
用 logs + traces 找出 /api/payments 是不是 root cause |
dependency-outage-false-lead |
api-gateway 的 5xx 是自己的問題還是 downstream 傳上來的? |
service-degradation-rca |
找出哪個 service 最先出問題 |
slow-path-hotspot-correlation |
把 slow path 的 logs 和 metrics 對應起來 |
cache-incident-blast-radius |
cache 問題影響了哪些 service |
評分標準包含:數字準確性(有 ground truth 對照)、推理是否基於工具結果而非憑空推測、結論是否區分主因和次要影響。
組件二:docker/ — 合成的 Observability 環境
docker/
  Dockerfile
  entrypoint.sh
  prometheus.yml  /  loki-config.yaml  /  tempo.yaml  /  datasources.yaml
  python/src/o11y_stack/
    generate_data.py           # 合成資料產生器
    provision_task_resources.py # task 專屬的 Grafana 資源
每次執行 benchmark trial,這個 sidecar 容器就從頭啟動,最終對外提供一個完整的 Grafana stack 加上 mcp-grafana(暴露 36 個 MCP 工具給 agent)。
啟動順序
容器啟動有嚴格的相依順序:

1. Loki + Tempo + Grafana 同時背景啟動
      ↓
2. 等 Loki、Tempo 的 /ready 端點回應
      ↓
3. generate_data.py — 產生 24 小時合成資料
   ├─ 寫 Prometheus TSDB block(用 promtool)
   ├─ 推 traces 到 Tempo(OTLP HTTP)
   └─ 推 logs 到 Loki(push API)
      ↓
4. 啟動 Prometheus(故意在這步才啟動)
      ↓   ← TSDB block 必須先存在才能被讀到
5. 等所有服務的 health endpoint
      ↓
6. provision_task_resources.py — 建立 task 需要的 dashboard
      ↓
7. 啟動 mcp-grafana(:8080)
      ↓
=== Environment Ready ===
Prometheus 故意在資料產生完才啟動,這是個有意思的工程細節:TSDB block 必須在 Prometheus 啟動前就存在才能被讀到,如果先啟動 Prometheus 再推資料,會有時序問題。
模擬的電商微服務系統

合成資料來自一個 5 個微服務的電商平台:
webapp → api-gateway → user-service
                     → order-service → user-service
                                     → payment-service
                     → payment-service
資料時間釘死在 scenario_time.txt,隨機種子 random.seed(42),確保每次跑同一道題拿到完全相同的資料——這是跨模型、跨時間比較的基礎。
三段刻意設計的故障
資料裡藏了三段相互獨立的 incident,這是整個 benchmark 的核心:

Incident 1:Error Spike(資料結尾前 3 小時,持續 30 分鐘)
payment-service 大量出錯,cascading 傳遞:
| 服務 | 故障期間 error rate |
|---|---|
| payment-service | 70% |
| order-service | 15%(cascading) |
| api-gateway | 8%(cascading) |
故障前 2 分鐘:Loki 有 payment-service 和 order-service 的 deployment log,暗示是部署引發的。
Incident 2:Latency 劣化(資料結尾前 6 小時,持續 45 分鐘)
order-service 回應變 5 倍慢,upstream 連帶受影響。/api/orders 有 60% 機率被標成 slow request(duration_ms 500–3000ms)。
Incident 3:Cache Refresh Lag(資料結尾前 9 小時,持續 40 分鐘)
user-service auth cache 更新卡住。service_cache_refresh_lag_seconds metric 最高到 520 秒,Loki 有帶 lag_seconds 和 stale_keys 欄位的 warn log。
精心設計的陷阱:traces 裡的 error span status 只標在真正的根源 span。upstream 的 webapp 和 api-gateway 雖然回傳 HTTP 500,但 span status 是 OK。模型如果偷懶只看最外層,會找錯根因——必須真的沿著 call chain 往下追。
合成資料涵蓋 24 小時,「資料結尾」就是模擬的「現在時間」(即 scenario_time.txt 裡釘死的那個時刻)。上面三段 incident 的時間都是相對這個「現在」往回推。這樣設計是因為 agent 解題時是站在「資料結尾」這個固定時間點往回看。
Prometheus Metrics 清單
| metric | 說明 |
|---|---|
http_requests_total{job, status} |
request 數,按 HTTP status code |
http_request_duration_seconds |
latency histogram(11 個 bucket) |
process_cpu_seconds_total |
CPU counter |
process_resident_memory_bytes |
記憶體 gauge |
service_retry_queue_depth |
retry backlog 深度 |
service_cache_refresh_lag_seconds |
cache lag(user-service 專用) |
provision_task_resources.py
某些 task 需要環境裡預先存在某個 dashboard(例如「修復這個壞掉的 dashboard」),這個腳本在 Grafana ready 後讀取 /task/setup.json,把需要的 dashboard 建好並確認可讀後才結束。目前 9 個 task 有用到。
組件三:agents/ — 跑在容器裡的 Agent
agents/
  o11y_agent.py          # Harbor agent 入口(host 端)
  agent_runner.py        # 核心 loop(跑在 task 容器內)
  system_prompt.txt
  task_prompt.txt
  langchain_o11y_agent.py   # LangChain 版(示範用)
  gcx_opencode_agent.py     # 使用 gcx CLI 的替代版本
執行架構
Agent 分成兩層:
[Host]  O11yBenchAgent.run()         o11y_agent.py
          ├─ 上傳 agent_runner.py 進容器
          ├─ 轉傳 API keys 環境變數
          └─ 等容器結束,下載 trajectory.json
                   ↓
[容器]  agent_runner.py              (uv run 啟動)
          ├─ 連接 mcp-grafana(36 個工具)
          └─ while True loop
核心 Loop
while True:
    resp = await litellm.acompletion(messages, tools=mcp_tools)
    if no tool_calls:
        write trajectory, print "done", break
    for tc in tool_calls:
        out = await mcp_session.call_tool(tc.name, tc.args)
        messages.append(tool result)
    flush_trajectory()   # 每步都寫,partial work 不會丟失
設計上刻意簡單:純粹的 ReAct 循環,最多 50 步,透過 litellm 支援所有主流 provider。flush_trajectory() 每步都寫出,即使 trial 中途被取消也能保留部分紀錄。
Reasoning + Acting:模型輸出『下一步要做什麼』→ 執行工具 → 把結果丟回去 → 模型決定下一步,反覆到模型說『我答完了』。
Prompt 設計的關鍵細節
task_prompt.txt 有一個重要的時間控制:
<context>
Current time: {current_time}
</context>

{statement}
current_time 來自 O11Y_SCENARIO_TIME_ISO 環境變數(即 scenario_time.txt),強制 agent 把這個時間當作「現在」。如果 agent 用真實的 now() 查詢,拿到的資料範圍就會對不上合成資料,導致無法找到那三段 incident。
system_prompt.txt 裡有幾條關鍵指令:
必須基於工具回傳的資料做結論,不能靠記憶推測
建 Grafana dashboard 時一步給出完整 model
Act autonomously. Do not ask the user for clarification.
Trajectory 格式(ATIF-v1.6)
每次 trial 結束產出 trajectory.json:
{
  "schema_version": "ATIF-v1.6",
  "agent": { "model_name": "gemini/gemini-3-flash-preview", ... },
  "steps": [
    { "step_id": 1, "source": "system", "message": "..." },
    { "step_id": 2, "source": "user",   "message": "題目內容" },
    { "step_id": 3, "source": "agent",  "tool_calls": [...] },
    { "step_id": 4, "source": "agent",  "message": "最終回答" }
  ],
  "final_metrics": {
    "total_cost_usd": 0.064,
    "total_tool_calls": 4,
    "elapsed_seconds": 23.3
  }
}
這個檔案是後續 regrade 和行為分析的基礎。評分系統只需要 trajectory.json,不需要重跑 agent。
trajectory(軌跡)就是 agent 整次解題的完整紀錄:每一步它說了什麼、呼叫了哪個 工具、拿到什麼回應,全部依時序存下來。後續評分只要讀這個檔,不需要再跑一次 agent。
替代 Agent
除了預設 agent,repo 還提供兩種替代實作:
| Agent | 差異 |
|---|---|
LangChainO11yBenchAgent |
用 LangChain 框架,作為自訂 agent 的示範 |
GcxOpenCodeAgent |
使用 gcx CLI 而非 MCP tools,MCP 工具被全部移除,agent 只能透過 gcx 操作 Grafana |
組件四:grading/ — 雙層評分系統

grading/
  verifier.py           # 評分流程 main()
  checks.py             # deterministic check 執行
  facts.py              # ground truth 查詢與快取
  judge.py              # LLM judge(Claude)
  scoring.py            # 加權分數計算
  transcript_parser.py  # 解析 trajectory.json
  dashboard_state.py    # dashboard 狀態 check
  env_context.py        # 對 Grafana/Prometheus/Loki/Tempo 發請求
評分流程
trajectory.json  +  problem.yaml
         ↓
1. Deterministic checks
   grounding: 答案引用的 trace ID 是否來自工具結果?
   state:     Grafana 上 dashboard/datasource 是否符合規格?
         ↓
2. Resolve facts
   實際打 Prometheus/Loki/Tempo/Grafana API 拿 ground truth
         ↓
3. LLM rubric(Claude 當 judge)
   讀完整 transcript,逐條評 YES/NO
         ↓
4. 加權合算 → score (0.0–1.0)
官方部落格對評分設計的核心立場是:
"Our general grading philosophy is to always check against the ground truth of what the agent actually did, not just what it said."
對數字類的 criterion,benchmark 會拿相同的 PromQL 在相同資料上跑一遍;對 dashboard 類的操作,直接讀取已儲存的 panel JSON、驗證 variable binding、執行查詢並比對結果。Agent 的最終回答只是輔助,實際狀態才是評分依據。
第一層:Deterministic Checks
程式直接驗,快、精確,不需要 LLM。共有五種模式:
| mode | 驗什麼 |
|---|---|
tool_trace_id |
答案裡的 trace ID 必須真的出現在 Tempo tool result |
dashboard_state |
dashboard 存在且 panels/variables/annotations 符合規格 |
datasource_inventory |
Grafana 有指定的 datasource types |
datasource_detail |
指定 datasource 有正確的 type/URL/access mode |
tempo_trace_service_inventory |
Tempo 有指定 service 的 trace 資料 |
tool_trace_id 防的是一個常見的 LLM 行為:模型「知道」系統用了 Tempo,所以直接捏造一個看起來合理的 trace ID 格式。Grounding check 強制要求 trace ID 必須出現在這次 trial 的工具回傳結果裡。
第二層:LLM Rubric
用另一個 Claude 當 judge。Judge 的 prompt 結構:
<transcript>
  [System]: ...
  [User]: 題目
  [Assistant Tool Call]: query_prometheus(...)
  [Tool Result]: {"data": [...]}
  [Assistant]: 最終回答:payment-service error rate 峰值為 3.4%
</transcript>

Based on the transcript above, evaluate each criterion:

<criteria>
  <criterion id="0">The final response states the peak error rate accurately.
  Source of truth: The canonical query returned 0.034.</criterion>
</criteria>
Source of truth 是 facts.py 實際打 Prometheus API 拿到的數字,讓 judge 有明確的對照基準。Judge 回傳:
<evaluation id="0">
<answer>YES</answer>
<explanation>Response states 3.4% which matches the canonical value 0.034.</explanation>
</evaluation>
Context budget 設計:Judge prompt 有三段長度嘗試(180K / 120K / 80K chars),遇到「prompt is too long」錯誤時自動縮短重試,縮短策略是先壓 thinking 和 tool result,最後才截頭截尾。
分數計算
scoring.py 非常單純:
def calculate_score(subscores, weights) -> float:
    normalized = normalize_weights(weights)
    return sum(s * w for s, w in zip(subscores, normalized))
checks 和 rubric 的 weight 一起正規化,所以兩層的相對比重由各自的 weight 值決定,不是固定的 50/50。
重新評分(Regrade)
如果修改了 rubric 或評分邏輯,可以只重跑評分部分,不需要重跑 agent:
uv run python -m o11y_bench regrade --job-dir jobs/<job-name>
verifier 會讀取已存在的 trajectory.json,重跑 checks 和 LLM judge,覆寫 grading_details.json 和 reward.txt。需要真實 Grafana stack 的 check(如 dashboard_state)會自動起臨時的 sidecar stack。
組件五:o11y_bench/ — 排程與執行協調
這層是 Harbor 框架的使用者:負責把 tasks、agents、environments 組合起來,按照 job config 排程執行,處理 retry 邏輯,以及在執行完成後觸發 reporting。
關鍵行為:
Resume 機制:bench:job 會按 job directory 名稱 resume。如果 job 已存在且 config 相容,直接跑剩下的 trial,不重跑已完成的。這讓中途中斷的 job 可以繼續接著跑。
Retry 設定(來自昨天的 config):
"retry": {
  "max_retries": 1,
  "exclude_exceptions": [
    "AgentTimeoutError", "RewardFileNotFoundError",
    "VerifierOutputParseError", "RewardFileEmptyError"
  ]
}
RewardFileNotFoundError 被排除在 retry 之外——這代表這類錯誤不會自動重試,需要人工介入調查。
簡單說:前四個組件是「零件」,這一層是把零件組裝起來、按順序執行、處理失敗的「 指揮中心」。當你執行 mise run bench:job 時,呼叫的就是這層。
組件六:reporting/ — 結果視覺化
reporting/
  run_report.py       # 單一 job 的 HTML 報告
  report.py           # 跨模型 suite leaderboard
  compare_report.py   # 兩個 job 並排比較
  report_data.py      # 核心資料載入與分類
  summary.py          # TrialRow / TaskSummary 聚合計算
三個關鍵指標
| 指標 | 意思 | 解讀方式 |
|---|---|---|
| pass@k | ≥1 次 trial 通過的 task 比例 | 模型「最好狀況」的能力上限 |
| pass^k | 所有 k 次 trial 都通過的比例 | 模型的穩定性 |
| mean_score | 所有 trial 的平均分(含部分分) | 整體表現 |

一題跑 3 次,pass@3 = 3 次裡至少 1 次過;pass^3 = 3 次都要過。on-call 想要的是後者——你不會希望「值班 3 次裡有 1 次能找到 bug」。
為什麼 leaderboard 以 pass^k 排序
官方的設計決策是:leaderboard 以 pass^k(一致性)為主要排名指標,而不是 pass@k(最好情況)。原因在於 observability 的使用情境——on-call 的時候,你需要的是「每次都對」,而不是「運氣好的時候對」。pass@k 和 pass^k 之間的差距本身就是一個重要訊號:差距大代表模型有能力但不穩定,不適合生產環境;差距小代表行為可預測。
幾種典型的解讀模式:
pass@3 高、pass^3 低:有能力但不穩定,需要多試幾次
pass@3 ≈ pass^3:穩定,行為可預測(不論對錯)
mean_score 高但 pass_rate 低:很多題都拿到部分分,但沒有一題完全答對
輸出 Artifacts
jobs/<job-name>/
  run_report.html                   # 單一模型報告(自動生成)
  result.json                       # 所有 trial 分數摘要
  <task-name>__<trial-id>/
    agent/trajectory.json           # 完整對話 + 所有 tool calls
    agent/command-0/stdout.txt      # 每步工具呼叫摘要
    verifier/reward.txt             # 分數(0.0–1.0)
    verifier/grading_details.json   # 各 criterion 分數 + judge 解釋
grading_details.json 裡的 explanation: 欄位是診斷模型行為最直接的入口:
{
  "score": 0.45,
  "The final response identifies the root cause service.": 0.0,
  "explanation:The final response identifies...": "Agent said order-service but canonical query shows payment-service as the root cause"
}
實測結果:Gemini 3 Flash Preview(2026-05-02)
測試配置
| 項目 | 值 |
|---|---|
| 模型 | google/gemini-3-flash-preview |
| Reasoning effort | off |
| 每題嘗試次數 | k=3(理論 189 trials) |
| 實際執行 | 100 trials(job 未完整結束) |
| 有效評分 | 83 trials,平均分 0.710 |
| 錯誤 | 21 trials |
錯誤分布
| 類型 | 數量 | 意義 |
|---|---|---|
RewardFileNotFoundError |
11 | Agent 跑完但 verifier 找不到 reward file;依 retry 設定不會自動重試 |
NonZeroAgentExitCodeError |
5 | Agent 執行中崩潰 |
CancelledError |
5 | Trial 超時被取消 |
按類別分析
PromQL — 接近完美
幾乎全部滿分。唯一例外 promql-cache-refresh-lag-peak(0.55)。PromQL 語意嚴格、訓練資料充足,是目前模型最熟悉的能力域。
TraceQL — 整體良好
多數滿分,traceql-metrics-error-rate-by-service 其中一次 0.92(幾乎完美)。traceql-checkout-p99-by-service 得 0.0 是因為 NonZeroAgentExitCodeError(agent 崩潰),不是理解問題。
LogQL — 中等,變異最大
| 題目 | 分數 |
|---|---|
| retry-backlog-warnings、unwrap-p95-latency 等基礎題 | 1.0 |
| cache-refresh-peak-lag | 0.65 |
| multi-stage-pipeline | 0.625(兩次一致) |
| deployment-rollout-events | 0.609 |
| retry-vs-real-errors | 0.576 |
| top-5xx-endpoint(其中一次) | 0.36 |
| parse-json-logs(其中一次) | 0.0(崩潰) |
logql-multi-stage-pipeline 兩次都是 0.625 是個強訊號——說明模型對這個題型有固定的理解偏差,而不是偶發失誤。這個題目需要先 JSON 解析再用 unwrap 做 metric 計算,任何一步跑偏後續就全錯。
Dashboarding — 加法容易、改法困難
add-cache-lag-panels、add-deployment-annotation:兩次都是 1.0create-cache-incident-review:0.90add-retry-backlog-panels:0.773update-add-service-variable:0.455(兩次一致)
dashboard-update-add-service-variable 固定 0.455 最值得關注——這道題要在所有現有 panels 加上 service variable binding,讓選不同服務時 panels 跟隨過濾。分數暗示模型能新增 variable,但無法把 variable 正確插入每個 panel 的查詢 template 裡。
Investigation — 清楚的能力分界線

結果分成明顯兩群:
拿到滿分的(1.0):incident-triage、service-degradation-rca、cache-incident-blast-radius、retry-backlog-incident
固定卡在 0.45(兩次一致):
payments-path-root-causeslow-path-hotspot-correlationdeployment-blast-radius-check
0.45 不是完全失敗——模型能識別部分症狀,但無法完成完整的因果推理鏈。這三道題的共同點:需要把 metrics 數字 + logs 時間序列 + traces span 結構對應到同一個根因,並給出有量化依據的結論。滿分的那些題目只需要跨 2 個訊號,這 3 道需要 3 個訊號全部對準。

四個核心觀察
1. PromQL > TraceQL > LogQL 的能力梯度
符合直覺:PromQL 語法嚴格語意清楚;TraceQL 以結構化查詢為主;LogQL 需要理解 pipeline 概念且輸出是文字,容錯空間最小。
2. 新增比修改容易
在 Dashboarding 類別,新增 panels 幾乎全滿分,但修改 variable binding 固定失敗。這反映對 Grafana dashboard JSON schema 的理解深度不同:建新 panel 只需知道基本結構,修改 variable binding 需要理解整個 dashboard 的資料流。
3. 一致的低分比偶發的低分更有診斷價值
payments-path-root-cause 兩次 0.45、dashboard-update-add-service-variable 兩次 0.455、logql-multi-stage-pipeline 兩次 0.625——這些固定分數說明的是系統性理解缺口,是模型真正的能力邊界,而不是運氣問題。
4. 11 個 RewardFileNotFoundError 值得追查
依照 retry 設定,這類錯誤不會自動重試,需要逐一查看各 trial 的 verifier/grading_details.json,釐清是 agent 輸出格式問題還是 verifier 環境問題。
官方 Leaderboard 全局觀(GrafanaCON 2026)
以上是 Gemini 3 Flash Preview 單一模型的分析。官方在 GrafanaCON 2026 公布了更完整的跨模型比較,以下是重點摘要。
整體排名趨勢
leaderboard 以 pass^k(一致性)排序,而不是 pass@k(最好情況)。整體趨勢:
Anthropic Claude Opus 4.7(reasoning off) 拿到最高 pass^k,一致性最佳
Claude Opus 4.7(reasoning on) pass@k 更高但 pass^k 略低——開啟 reasoning 讓模型偶爾能解更難的題,但也增加了不穩定性
開源模型:Qwen 3.6 Plus 超越了部分較小的 Sonnet 和 GPT 變體,顯示開源模型在 observability 任務上已具競爭力
各類別的飽和程度
| 類別 | 狀態 |
|---|---|
| Grafana API、PromQL | 接近飽和,多數模型表現良好 |
| Tempo(TraceQL)、Loki(LogQL) | 中間層,仍有明顯差異 |
| Dashboarding | 最難,是目前最能區分模型的類別 |
Dashboard 任務之所以最難,是因為它同時考驗四件事:state 正確、query 語法正確、variable wiring 正確、saved behavior 符合預期——任何一層出錯都會被 deterministic check 抓到。
一個值得注意的任務設計細節
官方提到 promql-retry-backlog-triage 這個任務揭示了一個有趣的 tradeoff:高 reasoning 或高 token 消耗的 agent,反而容易在這道題上過度蒐集資訊、繞遠路。這暗示 observability 任務的評分不只是「對不對」,也是「有沒有效率地對」——而 benchmark 的 cost 和 tool call 數量指標正好捕捉這個面向。
如何自己跑
環境需求
# 安裝工具鏈
git clone <repo>
cd o11y-bench
mise install
uv sync

# 設定 API keys
export ANTHROPIC_API_KEY=...   # grading 用(必要)
export GOOGLE_API_KEY=...      # 如果要跑 Gemini
export OPENAI_API_KEY=...      # 如果要跑 GPT
快速驗證(單一題目)
mise run bench:job -- --model google/gemini-3-flash-preview \
  --task-name query-cpu-metrics --n-concurrent 1
跑完整 63 題
mise run bench:job -- --model google/gemini-3-flash-preview
跑所有模型全部題目(完整 suite)
mise run bench:suite
沒有 Anthropic API key 也能跑
export SKIP_LLM_GRADING=1
export ANTHROPIC_API_KEY=dummy   # Harbor 前置檢查需要這個變數存在,填假的即可
mise run bench:job -- --model google/gemini-3-flash-preview --task-name query-cpu-metrics
注意:investigation 類的 task 全靠 LLM rubric,這種模式下分數會是 0,但 agent 行為本身還是會跑完。
重新評分(不重跑 agent)
uv run python -m o11y_bench regrade --job-dir jobs/<job-name>
其他常用指令
mise run test             # 跑 pytest 測試套件(驗 benchmark 邏輯,不需要 Docker)
mise run lint             # Ruff lint
mise run typecheck        # mypy
mise run setup:sync       # 從 tasks-spec/ 重新生成 tasks/
mise run setup:preflight  # 預先 build Docker image、清理舊容器

# 重建單一 job report
uv run python -m reporting.run_report --job-dir jobs/<job-name>

# 兩個 job 並排比較
uv run python -m reporting.compare_report \
  --job-dir jobs/<suite-id>/<job-a> \
  --job-dir jobs/<suite-id>/<job-b>
解讀結果
每個 trial 目錄下有三個關鍵檔案:
jobs/<job-name>/<task-name>__<trial-id>/
  agent/trajectory.json          # 完整對話 + 所有 tool calls
  verifier/grading_details.json  # 各 criterion 分數 + judge 解釋
  verifier/reward.txt            # 最終分數(0.0–1.0)
grading_details.json 裡的 explanation: 欄位直接說明 judge 為什麼扣分,是診斷模型行為最有效的入口。
拿來測試你們自己的 Agent
o11y-bench 不只是用來跑公開 leaderboard 的工具,更實際的用途是讓你在開發 agent 的過程中,對著真實的 Grafana stack 持續驗證能力。接入的方式取決於你的 agent 形態,有三條路。

路線一:只換 model,架構不動
最快的起點——你的 agent 本質上是「LLM + tool use loop」,只是想換成自己的模型或推論服務:
# 換成自己的模型
mise run bench:job -- --model your-provider/your-model

# 接 OpenAI-compatible 自架服務
export OPENAI_API_BASE=https://your-inference-server
mise run bench:job -- --model openai/your-model-name
這條路適合:評估特定 model 在 observability 任務上的能力、比較不同 reasoning effort 設定的效益。
路線二:接入自己的 Agent Framework
如果你的 agent 用了自己的 framework(LangChain、自製 loop、LlamaIndex 等),需要實作一個薄薄的 Harbor agent class。Repo 裡的 agents/langchain_o11y_agent.py 就是範本,照著結構改:
# agents/my_team_agent.py
from harbor.agents.base import BaseAgent

class MyTeamAgent(BaseAgent):
    async def setup(self):
        pass  # 環境準備,可留空

    async def run(self, task):
        statement = task.statement   # 題目文字
        current_time = ...           # 從環境變數 O11Y_SCENARIO_TIME_ISO 讀

        # 用你的 framework 跑 agent loop
        # MCP server 在 http://localhost:8080/sse(mcp-grafana)
        result = await your_framework.run(statement, mcp_url="http://localhost:8080/sse")

        # 把結果寫到 /logs/agent/trajectory.json
        self.write_trajectory(result)
執行:
mise run bench:job -- --model your/model \
  --agent-import-path agents.my_team_agent:MyTeamAgent
Trajectory 格式要求:grading 系統只需要能讀到 steps 和最終的 assistant message,最簡化的結構:
{
  "schema_version": "ATIF-v1.6",
  "steps": [
    { "step_id": 1, "source": "user",  "message": "題目內容" },
    { "step_id": 2, "source": "agent", "tool_calls": [
        { "id": "tc1", "name": "query_prometheus", "arguments": {...} }
    ]},
    { "step_id": 3, "source": "tool",  "tool_call_id": "tc1", "content": "..." },
    { "step_id": 4, "source": "agent", "message": "最終回答" }
  ],
  "final_metrics": { "total_cost_usd": 0.0, "total_tool_calls": 3 }
}
grading 的 LLM rubric 讀的是最後一個 source: "agent" 且有 message 的 step;deterministic check 讀的是所有 source: "tool" 的 content。只要這兩段正確,分數就能算出來。
路線三:Agent 不用 MCP,有自己的 Grafana 操作方式
如果你的 agent 已經有自己一套跟 Grafana 互動的方法(REST API wrapper、自製 SDK、CLI tool),可以參考 agents/gcx_opencode_agent.py——它把 MCP tools 全部移除,改讓 agent 透過 gcx CLI 操作 Grafana。
你的 agent class 在 run() 裡可以完全自主決定怎麼操作 Grafana,只要最終產出格式正確的 trajectory.json 就行。sidecar 容器裡的 Grafana 端口是固定的(:3000),Prometheus 在 :9090,Loki 在 :3100,Tempo 在 :3200。
建議的起步順序
無論哪條路,建議這樣進入:
1. 先跑預設 agent 確認環境正常
mise run bench:job -- --model your/model --task-name query-cpu-metrics --n-concurrent 1
這一步驗證 Docker 環境、API key、model provider 都通了。
2. 挑 2–3 道你最在意的 task 重點觀察
不需要跑全部 63 題。根據你的 agent 設計,挑最相關的類別:
如果你的 agent 主打查詢能力:
promql-error-rate、logql-multi-stage-pipeline如果你的 agent 主打根因分析:
incident-triage、payments-path-root-cause如果你的 agent 主打 Grafana 操作:
dashboard-create-service-overview、dashboard-update-add-service-variable
3. 讀 grading_details.json,理解評分標準
cat jobs/<job-name>/<task-name>__<trial-id>/verifier/grading_details.json
explanation: 欄位會直接告訴你 judge 為什麼扣分。在開始改 agent 之前,先確認評分標準符合你的預期——如果有 criterion 的定義不合理,直接去 tasks-spec/ 修改 rubric,跑 regrade 就能看到新分數,不需要重跑 agent。
4. 接入自己的 agent,跑完整 63 題
確認了環境和評分標準之後,再把自己的 agent 接進來跑完整 benchmark。這時候的分數才有意義——你能知道自己的 agent 在哪個類別有系統性的弱點,以及跟公開 leaderboard 上的其他模型相比在什麼位置。
小結
o11y-bench 的設計哲學是不測試模型「知道」什麼,而是測試模型「能做到」什麼:
tasks-spec/用自然語言出題,不洩露語法提示docker/跑起真實 stack,資料釘死確保可重現agents/用輕量 ReAct loop,讓工具能力差異直接顯現grading/用 deterministic check 防幻覺,用 LLM rubric 處理語意判斷
從 Gemini 3 Flash Preview 的結果來看,0.710 的平均分顯示結構化查詢已相當成熟,但跨訊號根因分析和精確修改複雜資源結構這兩個能力邊界仍然清晰。整體 leaderboard 的趨勢也印證了這點:PromQL 和 Grafana API 類別接近飽和,Dashboard 和 Investigation 仍是區分模型能力的主戰場。
o11y-bench 刻意設計成 可檢驗(inspectable)、可重現(reproducible)、開放挑戰(open to challenge)。資料、題目、評分邏輯全部開源,任何人都可以在本地重現結果、加入新的 agent harness、或對評分標準提出質疑。這和那種「只公布分數、不公布方法」的封閉 benchmark 不同——結果的意義來自於它背後的流程是透明的。
leaderboard 持續更新在 o11ybench.ai,提交新結果見 Hugging Face 投稿 repo,官方介紹文見 Grafana Blog。